
A 20-year Historical Chart of US Stock Markets & Fed Funds Rate

Return to KirkLindstrom.com home page
|
Stock Markets vs. Federal Funds Rate A 20-year Historical Chart of US Stock Markets & Fed Funds Rate |
|
| Charts
and price quote for DJIA Return to KirkLindstrom.com home page |
|
|
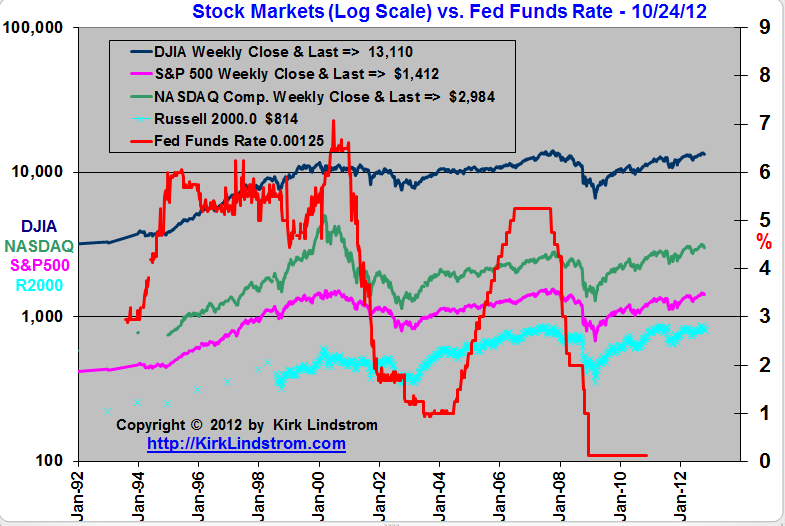
| October 24, 2012:
"Don't fight the Fed" is a popular saying on financial TV. This
chart shows A 20-year Historical Chart of US Stock Markets (DOW, NASDAQ
and S&P500) vs the Fed Funds Rate. |
|
For market commentary and my current outlook for select stocks I like, read "Kirk's Investment Newsletter." Kirk's Investment Newsletter => Free Sample Issue
|
|
|
Article: Beware
of
Annuities
Article
Index
|
|
 |
|
|
Note 1. Source:
Chart of
the Day "Journalists
and bloggers may post the above free Chart of
the Day on their website as long as the chart is
unedited and full credit is given with a live
link to Chart of the Day at
http://www.chartoftheday.com."
Charts
and current price quote for Crude Oil Prices |
||||
| KirkLindstrom.com Home of "CORE & Explore®" investing. |
Blog |
|||
Disclaimer: The information contained in this web site is not intended to constitute financial advice, and is not a recommendation or solicitation to buy, sell or hold any security. This blog is strictly informational and educational and is not to be construed as any kind of financial advice, investment advice or legal advice. Copyright © 2012 Kirk Lindstrom. Note: "CORE & Explore®" was coined by and is a registered trademark of Charles Schwab & Co., Inc. |
||||