
" Historical S&P500 Price to Earnings Ratio Charts "

Return to KirkLindstrom.com home page
|
S&P500 PE & P/E10 - CAPE History " Historical S&P500 Price to Earnings Ratio Charts " |
|
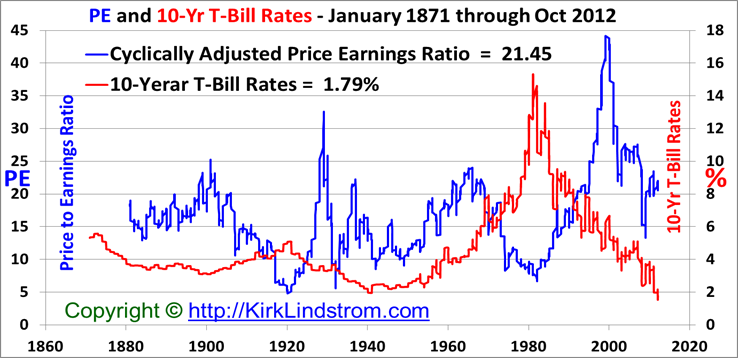
| Chart of S&P500 Price-to-earnings
or PE Ratio, 10-year US Treasury Rates and Shiller CAPE P/E10
Ratio from 1860 through 2012. Return to KirkLindstrom.com home page |
|
|
|
October 26, 2012: PE
ratios usually fall when investors slowly lose interest in
stocks. The exceptions are bear market crashes when
companies lose money and write off everything but the
kitchen sink to often show negative earnings. Table and excerpt from my November 2012 ( Subscribe to get it now) Newsletter: Data updated 10/19/12 courtesy of Robert Shiller, Yale Department of Economics. In Sheller`s modified P/E, the denominator is not current earnings per share but average inflation-adjusted earnings over the trailing 10 years. This modified ratio, sometimes called P/E10, or CAPE (Cyclically Adjusted Price Earnings) ratio, is said to have better forecasting record than the simple P/E ratio. I like tracking this as it gives a different opinion than the more bullish Fed Model. |
| => Remember
that S&P predicted $100 for 2009 GAAP earnings
before the 2007 to 2009 bear market so these estimates
are better for looking at current valuations than
predicting the future. In 2000, the analysis clearly
showed the market was overvalued, thus it had some
value as an indicator. The S&P500 came very close to having zero earnings at the peak of the financial crisis. When you divide stock price by nearly zero earnings, you get a very, very high PE. |
||
|
From Chartoftheday.com1
Today's chart illustrates the price to earnings ratio (PE ratio) from 1900 to present. Generally speaking, when the PE ratio is high, stocks are considered to be expensive. When the PE ratio is low, stocks are considered to be inexpensive. From 1900 into the mid-1990s, the PE ratio tended to peak in the low to mid-20s (red line) and trough somewhere around seven (green line). The price investors were willing to pay for a dollar of earnings increased during the dot-com boom (late 1990s), surged even higher during the dot-com bust (early 2000s), and spiked to extraordinary levels during the financial crisis (late 2000s). Since the early 2000s, the PE ratio has been trending lower with the very significant but relatively brief exception that was the financial crisis. More recently, the PE ratio has moved slightly higher. It is worth noting, however, that even with this recent uptick, the PE ratio still remains at a level not often seen since 1990. 
Article:
Beware
of
Annuities
|
|
|
|
Note 1. Source:
Chart of the
Day "Journalists and bloggers
may post the above free Chart of the Day on their
website as long as the chart is unedited and full
credit is given with a live link to Chart of the Day
at http://www.chartoftheday.com."
|
||
 |
||
| KirkLindstrom.com Home of "CORE & Explore®" investing. |
Blog |
|||
FREE=> Investment
Letter
SAMPLE <==
FREE
Disclaimer: The information contained in this web site is not intended to constitute financial advice, and is not a recommendation or solicitation to buy, sell or hold any security. This blog is strictly informational and educational and is not to be construed as any kind of financial advice, investment advice or legal advice. Copyright © 2012 Kirk Lindstrom. Note: "CORE & Explore®" was coined by and is a registered trademark of Charles Schwab & Co., Inc. |
||||