
|
Gold and GLD Resistance & Support Levels for the price of gold and GLD. |
 |
| Return
to
KirkLindstrom.com
home or Charts page Quotes and Charts for Gold & GLD (the ETF for Gold) |
|
|
|
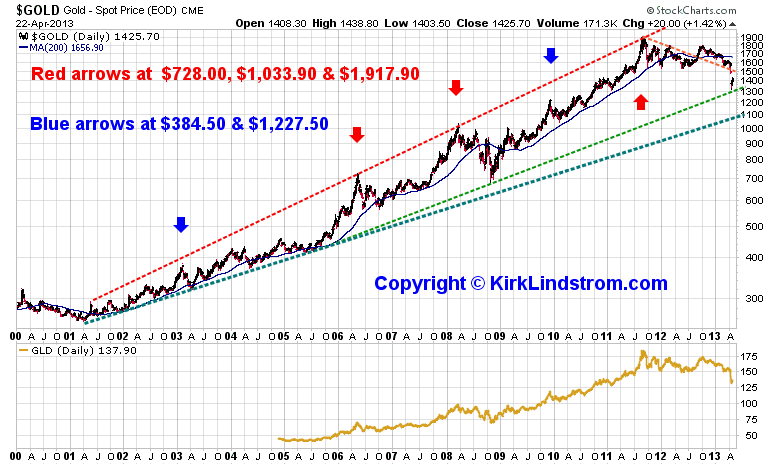
April 23, 2013: Resistance and Support Levels for the price of gold and its ETF GLD.
Two weeks ago, Gold broke the dashed orange support line and crashed all the way down to my dashed green support line that I first drew in this August 25, 2011 post showing Gold at the top of the channel at $1,856. The monthly point and figure (P&F) chart pattern for a "Traditional, 3 box reversal chart" has a bearish price objective of $1,040, just below my lower dashed green support line. |
Monthly point and figure (P&F) pattern for a "Traditional, 3 box reversal chart: 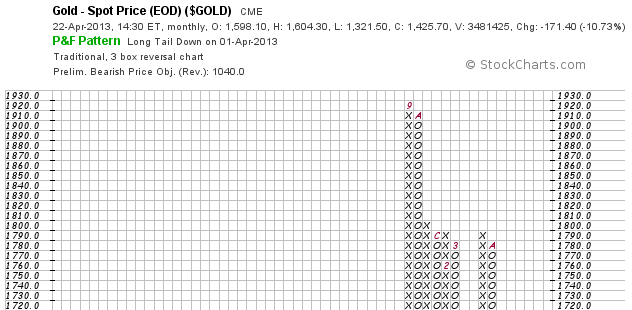 .....snip... 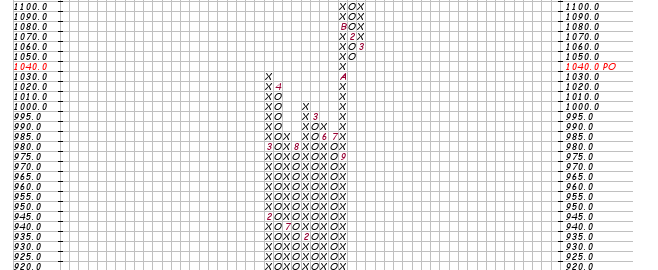 Quotes and Charts for Gold & GLD (the ETF for Gold) DOW to Gold Ratio |
|
 |
|
| KirkLindstrom.com Home of "CORE & Explore®" investing. |
Blog |
||||
FREE=> Investment
Letter
SAMPLE <==
FREE
Disclaimer: The information contained in this web site is not intended to constitute financial advice, and is not a recommendation or solicitation to buy, sell or hold any security. This blog is strictly informational and educational and is not to be construed as any kind of financial advice, investment advice or legal advice. Copyright © 2012 Kirk Lindstrom. Note: "CORE & Explore®" was coined by and is a registered trademark of Charles Schwab & Co., Inc. |
|||||