 |
NYSE Stocks Above Moving Averages " The Percentage of NYSE Stocks Above their 200 & 50 DMAs " |

|
| Return
to
KirkLindstrom.com
home page and Charts
page Newsletter: Subscribe - More Charts |
|
|
|
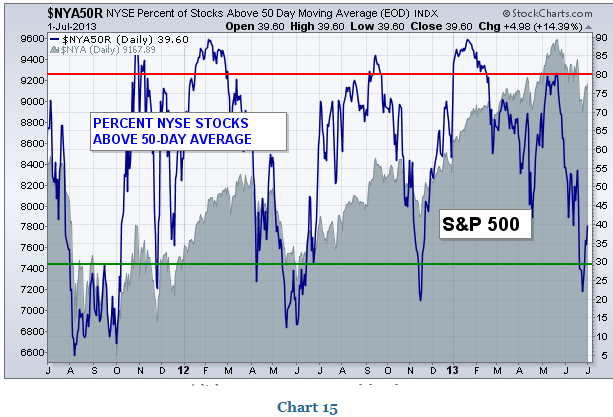
July 2, 2013: These charts from John Murphy1
show the percentage of NYSE stocks above their 200 and 50 day moving
averages (DMAs on the charts) has started to bounce of greatly oversold
levels that in the past marked major trading bottoms. Murphy
concludes the message of the markets is bullish.
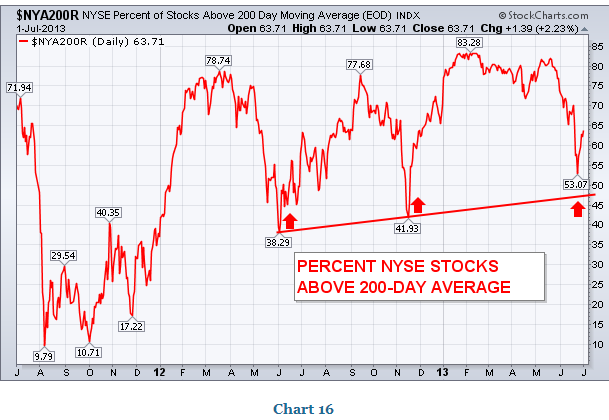
As part of today's (Tue, Jul 2 2013 1:12 PM ET) "Market Message," John Murphy wrote: PERCENT NYSE STOCKS ABOVE MOVING AVERAGES IMPROVES... Chart 15 plots the Percent of NYSE stocks trading above their 50-day averages. The blue line recent plunged from overbought territory over 80% to oversold territory near 20%. And it is starting to improve. That's usually how stock corrections end. I'd like to see it climb above its mid-June peak at 55% to confirm that upturn. The red line in Chart 16 plots the Percent of NYSE stocks above their 200-day averages. The line fell to 53% during June before rebounding back over 60%. The red line remains above a rising trendine drawn under its 2012 lows. It would have to break that support line to signal a bigger stock market downturn. Right now, the major trend is still up....Links for live charts for the Percent of NYSE stocks trading above their 200 and 50-day moving averages
Percent of NYSE stocks trading above their 50-day averages
| ||
Percent of NYSE stocks trading above their 200-day averages
 ==> My returns by year & New Record Highs <== Live chart links for:
For more explanation about what I offer, see
"Kirk's Two Investment Letters - Which is Best for You?" Article: Beware of Annuities |
|
|
|
Note 1. Source: The StockCharts.com Market Message at http://stockcharts.com/members/analysis/20130702-1.html
|
||
 |
||
| KirkLindstrom.com Home of "CORE & Explore®" investing. |
Blog |
|||
FREE=> Investment
Letter
SAMPLE <==
FREE
Disclaimer: The information contained in this seb site is not intended to constitute financial advice, and is not a recommendation or solicitation to buy, sell or hold any security. This blog is strictly informational and educational and is not to be construed as any kind of financial advice, investment advice or legal advice. Copyright © 2013 Kirk Lindstrom. Note: "CORE & Explore®" was coined by and is a registered trademark of Charles Schwab & Co., Inc. |
||||