KirkLindstrom.com - Articles - 2013 - Elaine Garzarelli's Indicators are Bullish - Chart of Buy and Sell Signals
Kirk
                Windsurfing at Palo Alto in SF Bay in May 2009  Elaine Garzarelli's Indicators are Bullish
 
Chart Showing Elaine Garzarelli's Buy &Sell Signals
Kirk
                Windsurfing at Coyote Point November 2009


Return to KirkLindstrom.com home, Articles and Charts page.
 

S&P500 Daily Data
Day       Date       Open       High        Low      Close      Volume 
=== ========== ========== ========== ========== ========== =========== 
Tue 10-15-2013    1709.17    1711.57    1695.93    1698.06  2188114688 
Mon 10-14-2013    1699.86    1711.03    1692.13    1710.14  1710337408 
Fri 10-11-2013    1691.09    1703.44    1688.52    1703.20  2002574336
October 15, 2013:  Elaine Garzarelli's market timing indicators are currently bullish according to her press release published today in the Sacramento Bee.  Garzarelli expects the S&P500 to gain 14% and reach 1943 in the next year:
"President Obama nominated Janet Yellen to be the Fed chair starting next year and as the first female chair, her tenure would mark a historic milestone. Markets are pleased with the nomination as it removes uncertainty and represents stability and continuity in monetary policy.  We believe Yellen will be good for stocks as well as rate-sensitive housing, autos, and consumer durables. She had been a supporter of unconventional policy such as QE. Yellen will likely be a dovish Fed chairperson like Bernanke, and would likely proceed slowly and cautiously, but would not necessarily delay the start of tapering. We do not anticipate that inflation will run higher than 2.0 percent during her tenure." 
For more on Garzarelli's indicators and outlook, see below for my Summary of Elaine Garzarelli's comments.

Chart 1 shows
Elaine Garzarelli's buy and sell signals vs. the S&P500 from 1981 through today.
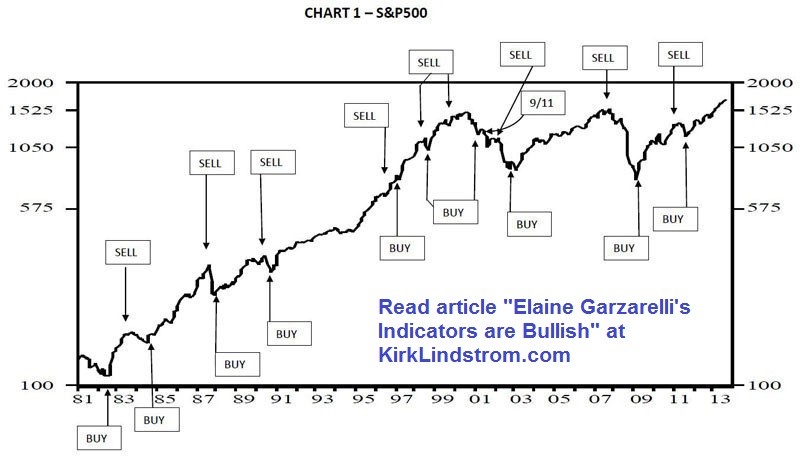
Chart Showing Elaine Garzarelli's Buy &Sell Signals
Click for FREE sample of Kirk Lindstrom's                    Investment Letter

Summary of Elaine Garzarelli's Bullish Outlook as of 10-15-13:
  • "Our proprietary stock market indicator composite rose to 71.5 percent from 68.5 percent as we upgraded the Bloomberg financial conditions index."
  • "A level for our composite above 65.0 percent is a buy signal after a sell signal. A sell signal is 30.0 percent and a correction signal is 42.0 percent. We still recommend an unhedged position and believe declines, if any, will be limited to 4.0 to 7.0 percent. T
  • "Our model projects a 17.5 P/E and our earnings forecast for the S&P 500 is 105.00 this year and 111.00 next year, compared to S&P's forecast of 108.00 and 122.25, respectively. Our forecast for S&P 500 earnings remains conservative relative to S&P's and still we look for a 14.0 percent gain in the S&P 500 to a level of 1943 for the S&P 500 over the next six to twelve months.
  • "This week one of our contrarian indicators – the number of bullish investment advisors became slightly less bullish as this indicator declined to 45.4 percent from 46.4 percent. The lower the number of bullish advisors, the better it is for stocks. This indicator is still ranked neutral-minus since a level above 53.0 percent is bearish."
  • "The Bloomberg financial conditions index turned around and rose over the last couple of days and therefore we upgrade it to neutral. This indicator measures stress in the markets by combining money-market rates, yields on government and corporate bonds, and volatility in equities.
  • "The economic cycle research institute weekly index (ECRI) gives a leading indication of cyclical turns in U.S. economic activity. After an uptrend for three months, the index declined this week and we believe it is due to the shutdown. We continue to rank it neutral."
  • "Our junk bond yield to 10-year T-bond yield indicator has been declining over the last week. This ratio has an inverse relationship with the S&P 500 and a decline is favorable for stocks. We rank this indicator neutral and watch it for a continued downturn."
Top of Page

Note 1.  Source:  chart courtesy of PR Newswire

 
TOP of Page


KirkLindstrom.com

Home of "CORE & Explore®" investing.

Blog

KirkLindstrom.com
Disclaimer:  The information contained in this web site is not intended to constitute financial advice, and is not a recommendation or solicitation to buy, sell or hold any security. This blog is strictly informational and educational and is not to be construed as any kind of financial advice, investment advice or legal advice. Copyright © 2013 Kirk Lindstrom. Note: "CORE & Explore®" was coined by and is a registered trademark of Charles Schwab & Co., Inc.