KirkLindstrom.com - Articles 2014 - Gold and GLD Resistance and Support Levels   ETF: GLD
Kirk
                Windsurfing at Palo Alto in SF Bay in May 2009  Gold and GLD Resistance & Support
 
Resistance & Support Levels for the price of gold and GLD.
Kirk                Windsurfing at Coyote Point November 2009
   Kirk Lindstrom's   Favorite Charts  -  Newsletter - Blog

Quotes and Charts for Gold & GLD (the ETF for Gold)
 

March 28, 2014:  Resistance and Support Levels for the price of gold and its ETF GLD.   Gold may have bottomed right at the dashed green support line I showed in an article last year.  There are three Key charts to watch:
  1. Gold and GLD prices from 2007 to Today:  Gold's ETF GLD turned from a downtrend to an uptrend when it broke above the dashed-green resistance turned support line.  It is currently testing this line from above.  A buy here with a stop below the line is how I would play this.
  2. Gold and GLD prices from 2000 to Today:  This chart shows Gold tested a 2013 low right at the rising dashed green support line just below $1200.  This tested "double bottom" signaled a reversal.
    • GLD just made a bullish "golden cross" and it is currently just below both its 50 and 200 day moving averages, a great time to buy compared to when it is making new highs.
    • My "fat pitch" is the dashed orange support line on chart 2
  3. The PNF (Point and Figure) chart shows a "double top breakout on Tuesday, January 21, 2014 with a "bullish price objective" revised to $1440.  (It was $1410 on my Jan. 23, 2014 update.)

I don't own gold (other than a small amount in physical form for "Armageddon Insurance") and warned of a possible top way back on August 25, 2011 with this post showing Gold at the top of the channel at $1,856

Currently, I'm watching the resistance line on Chart 1 and may buy for a trade and a tight stop at any time.  Chart 2 shows that if the current support breaks, then the next major support levels are mid $1200s at the dashed green line then $1100s for the dashed orange line.

Chart 1
 Resistance & Support Levels for the price of gold and GLD 


Chart 2
Resistance & Support Levels for the price of gold and GLD

Chart 3
Daily point and figure (P&F) pattern for a "Traditional, 3 box reversal chart: 


Point and Figure chart for Gold Price
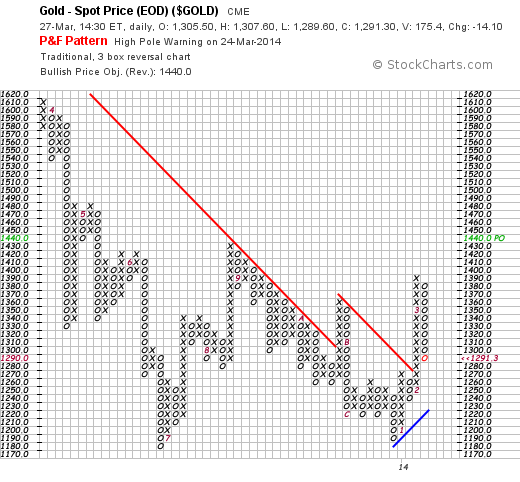
Quotes and Charts for Gold & GLD (the ETF for Gold)

DOW to Gold Ratio


Click for FREE sample of Kirk Lindstrom's                    Investment Letter
 
TOP of Page
note 1.  Source:  stockcharts.com


The Retirement Advisor KirkLindstrom.com

Home of "CORE & Explore®" investing.

Blog
Disclaimer:  The information contained in this web site is not intended to constitute financial advice, and is not a recommendation or solicitation to buy, sell or hold any security. This blog is strictly informational and educational and is not to be construed as any kind of financial advice, investment advice or legal advice. Copyright © 2014 Kirk Lindstrom. Note: "CORE & Explore®" was coined by and is a registered trademark of Charles Schwab & Co., Inc.