 |
S&P500 PE Ratio History Historical Price to Earnings Ratio of Standard and Poor's 500 Index |

|
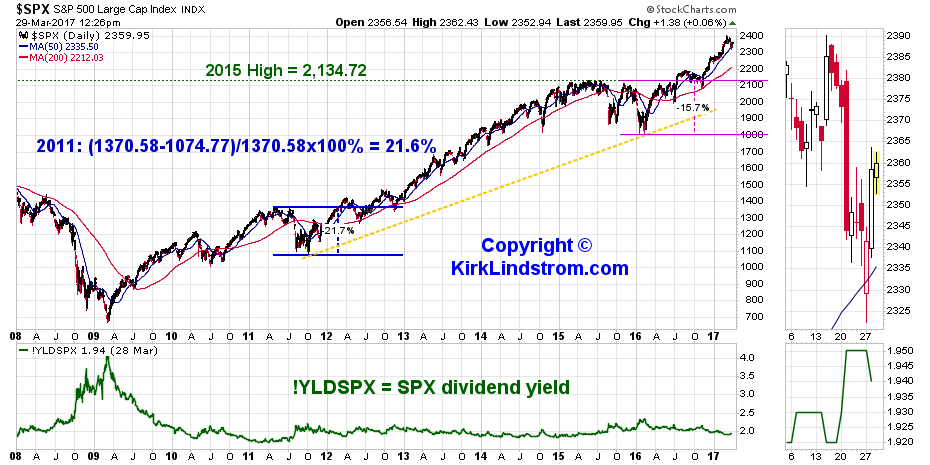
| Historical PE Ratio Chart - S&P500 as of March 29, 2017 KirkLindstrom.com: Favorite Charts & Graphs - More Articles |
|
|
| Last Article: History Of Dow Declines from 1896 - Next Article: |
|
|
|
March 29, 2017:
Currently, the PE ratio for the S&P500 remains at an historically high level. The S&P500 came very
close to having zero earnings at the peak of the
financial crisis which gave a huge spike in the PE ratio. When you divide
stock price by nearly zero earnings, you get a
very, very high PE. Today the markets have great earnings but they come at a high price.
From Chartoftheday.com1 "With fourth-quarter earnings largely in the books, today's chart provides some perspective on how the current earnings environment relates to the stock market, today's chart illustrates the price to earnings ratio (PE ratio) from 1900 to present. Generally speaking, when the PE ratio is high, stocks are considered to be expensive. When the PE ratio is low, stocks are considered to be inexpensive. From 1900 into the mid-1990s, the PE ratio tended to peak in the low to mid-20s (red line) and trough somewhere around seven (green line). Notice how most PE ratio peaks that occurred well above the upper threshold (red line) were a result of a massive bear market / recession. The only real exception to this was the dot-com boom which resulted in a PE ratio peak well above 30 in 1999 (even then, the PE ratio did not stay above 25 for long). Viewed in this way, the current PE ratio (25.0) is noteworthy and suggests that the stock market as a whole is by no means cheap."
|
|
|||||||||
 Note 1. Source: Chart of the Day - "Journalists and bloggers may post the above free Chart of the Day on their website as long as the chart is unedited and full credit is given with a live link to Chart of the Day at http://www.chartoftheday.com." |
||||||||||
 |
||||||||||
KEY articles to understand my method:
|
||
| KirkLindstrom.com Home of "CORE & Explore®" investing. |
Blog |
|
| Disclaimer: The information contained
in this web site is not intended to constitute
financial advice, and is not a recommendation or
solicitation to buy, sell or hold any security.
This blog is strictly informational and
educational and is not to be construed as any kind
of financial advice, investment advice or legal
advice. Copyright © Kirk Lindstrom.
Note: "CORE & Explore®" was coined by and
is a registered trademark of Charles Schwab &
Co., Inc. |
||

