|
Timer Digest (TD) Bulls Minus Bears Graph Short term plot of TD bulls minus bears |
 |
| Return
to
KirkLindstrom.com
home or Charts page |
|
|
|
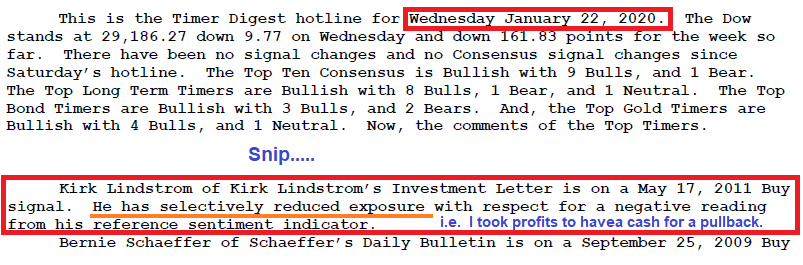
February 2, 2020: Along
with its regular newsletter, Timer Digest twice a week (usually on
Saturday and Wednesday) sends out a special Hotline Update of the top
timers it tracks. This graph shows the data.
 |
 |
| note 1. Source: Internal Revenue Service |
||
| KirkLindstrom.com Home of "CORE & Explore®" investing. |
Blog |
|
Disclaimer: The
information contained in this web site is not intended to constitute
financial advice, and is not a recommendation or solicitation to buy,
sell or hold any security. This blog is strictly informational and
educational and is not to be construed as any kind of financial advice,
investment advice or legal advice. Copyright © Kirk Lindstrom.
Note: "CORE & Explore ©" was coined by and is a registered trademark of Charles Schwab & Co., Inc.
|
||