
SOX Philly Semiconductor Index

Return to KirkLindstrom.com home page and Charts page
| KirkLindstrom.com - Charts - 2011 - SOX
Semiconductor Index Testing Neckline From Above |
==> TA Bible <== | |
|
Test of
SOX Neckline From Above SOX Philly Semiconductor Index |
|
Return to KirkLindstrom.com home page and Charts page |
||
|
|
| June 17, 2011. This chart shows
the SOX Semiconductor Index testing the neckline of a
bullish inverted Head-and-Shoulders
Bottom (Reversal) pattern.
Will this mark the bottom or the start of something worse? The PHLX Semiconductor Sector (SOX) is a Philadelphia Stock Exchange capitalization-weighted index composed of companies primarily involved in the design, distribution, manufacture, and sale of semiconductors. 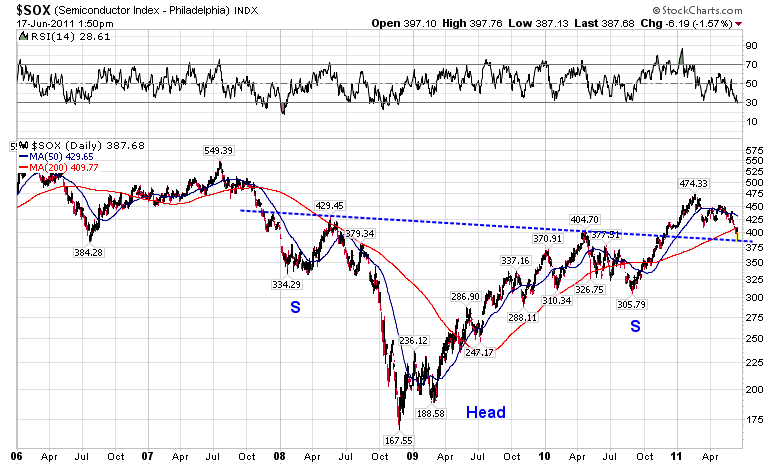 From "Head-and-Shoulders Bottom (Reversal) pattern The "Inverted Head and Shoulder Pattern" marks a major trend reversal. The pattern is made by three successive lows with the center low the lowest and the outside "shoulder" lows higher and ideally equal distrance from the neckline. The neckline is formed by the hights between the shoulders. The necline is often tested from above before the pattern takes off which gives conservative traders a second chance to buy the breakout. |
|
||
| Note 1: Chart courtesy of stockcharts.com at http://stockcharts.com | ||
 |
|||
Return to KirkLindstrom.com home page
|
Blog |
||