|
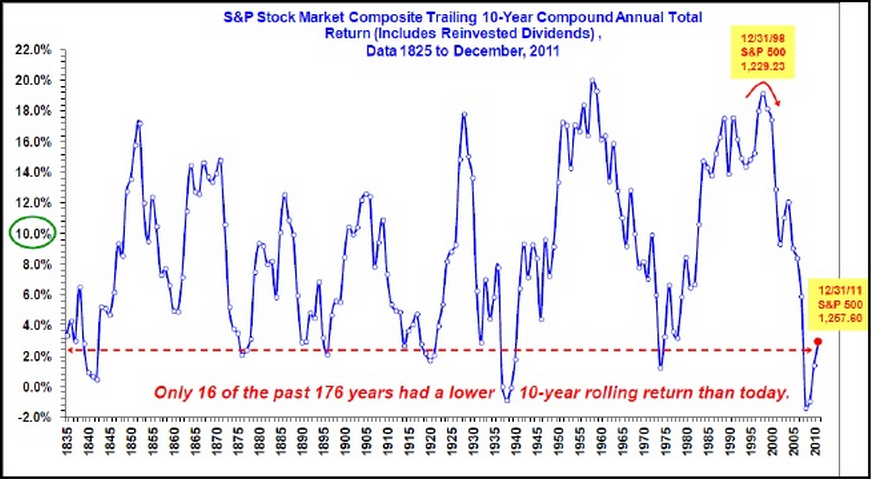
S&P500 Ten Year Trailing Total Returns Trailing 10 year compound annual total return for S&P500 |
 |
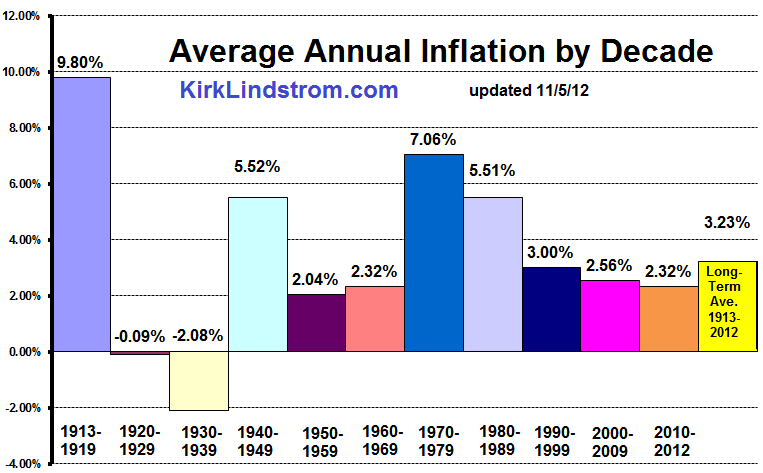
| Chart of Average Annual CPI Inflation Rate |
|
|
|
November 29, 2012:
S&P500 Ten Year Trailing Returns Trailing 10-Yr Compound Annual
Total Return (CATR) for the Standard and Poor`s 500 Index. from
http://www.zerohedge.com1 SPY Closing prices with dividends: 11/29/12 = $142.12 - 11/29/02= $77.26 Total Return = (142.12-77.26) / 77.26 x 100% = 83.95%; CATR = 6.28% = Where we are today on graph |
| note 1. Source: Zero Hedge: Marc Faber's Chart Porn Average Annual Inflation Rate by Decade data courtesy of www.InflationData.com |
| KirkLindstrom.com Home of "CORE & Explore®" investing. |
Blog |
|||
FREE=> Investment
Letter
SAMPLE <==
FREE
Disclaimer: The information contained in this web site is not intended to constitute financial advice, and is not a recommendation or solicitation to buy, sell or hold any security. This blog is strictly informational and educational and is not to be construed as any kind of financial advice, investment advice or legal advice. Copyright © 2012 Kirk Lindstrom. Note: "CORE & Explore®" was coined by and is a registered trademark of Charles Schwab & Co., Inc. |
||||