 |
Apple (AAPL) Resistance & Support Levels Historical Apple Data from 2008 to 2013 |

|
| Newsletter Subscribe Return to KirkLindstrom.com home page - Charts |
|
|
|
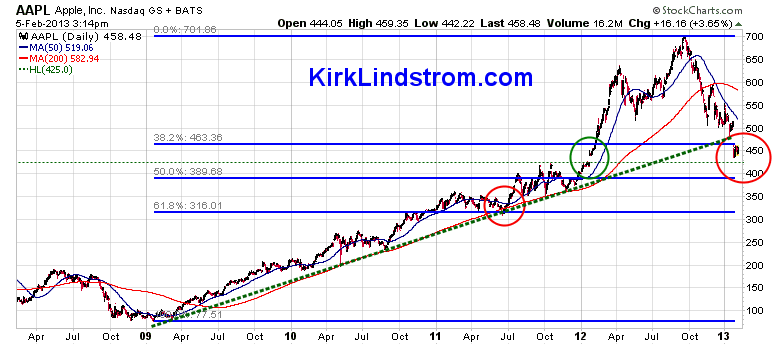
February 5, 2013: Below is a graph showing Apple (Ticker AAPL) Resistance & Support Levels from
2008. Key features listed below the graph. |
|
Key features:
|
|
|
 |
||
| KirkLindstrom.com Home of "CORE & Explore®" investing. |
Blog |
|||
FREE=> Investment
Letter
SAMPLE <==
FREE
Disclaimer: The information contained in this web site is not intended to constitute financial advice, and is not a recommendation or solicitation to buy, sell or hold any security. This blog is strictly informational and educational and is not to be construed as any kind of financial advice, investment advice or legal advice. Copyright © 2011 Kirk Lindstrom. Note: "CORE & Explore®" was coined by and is a registered trademark of Charles Schwab & Co., Inc. |
||||