|
Gold and GLD Resistance & Support Levels for the price of gold and GLD. |
 |
| Return
to
KirkLindstrom.com
home page Quotes and Charts for Gold & GLD (the ETF for Gold) |
|
|
|
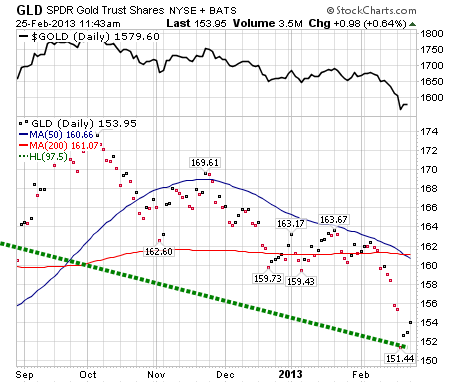
February 25, 2013: Last week as the price of gold fell, I posted "Gold and GLD Resistance and Support Levels" where I showed a dashed green resistance line. I wrote:
"Note how a bounce off the dashed red resistance-turned-support line in April 2009 in the $800s was very bullish. Four years later, Gold is making a similar test of resistance turned support."This chart shows GLD, the exchange traded fund for gold, again bounced nicely off support. My second and third charts below also show a closeup up this GLD chart on a closing basis. For more information and charts, see my Feb 20, 2013 Seeking Alpha article: |
|
|
|
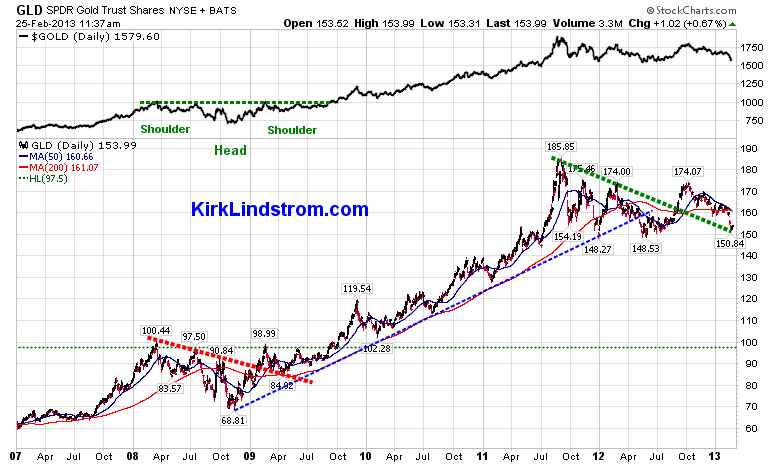
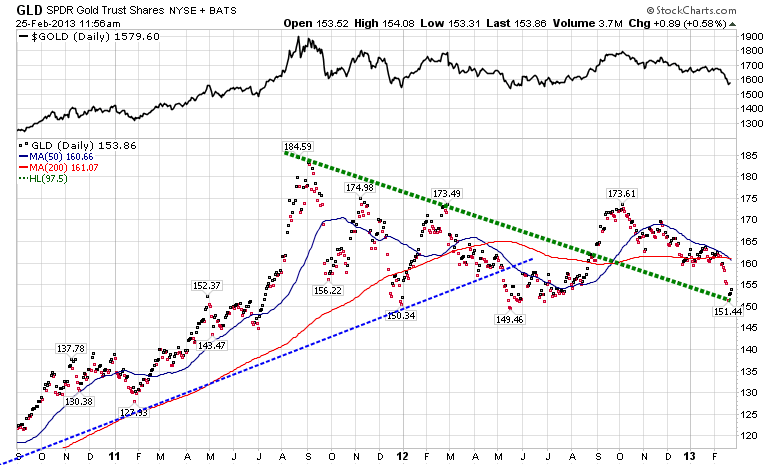 For more information and charts, see my Feb 20, 2013 Seeking Alpha article "Is It Time To Buy Gold Via GLD?" |
|
 |
|
| KirkLindstrom.com Home of "CORE & Explore®" investing. |
Blog |
||||
FREE=> Investment
Letter
SAMPLE <==
FREE
Disclaimer: The information contained in this web site is not intended to constitute financial advice, and is not a recommendation or solicitation to buy, sell or hold any security. This blog is strictly informational and educational and is not to be construed as any kind of financial advice, investment advice or legal advice. Copyright © 2012 Kirk Lindstrom. Note: "CORE & Explore®" was coined by and is a registered trademark of Charles Schwab & Co., Inc. |
|||||