|
Apple (AAPL) Resistance & Support Levels Historical Apple Data from 2008 to 2013 |

|
| Newsletter Subscribe Return to KirkLindstrom.com home page - Charts |
|
|
|
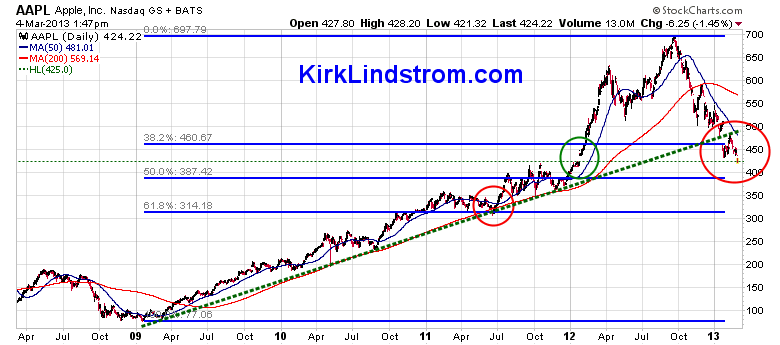
March 4, 2013: Apple just filled the open gap I pointed out to my subscribers
last year as one reason I was not interested in Apple when it was near
all-time highs. I also wrote two Seeking Alpha Articles about
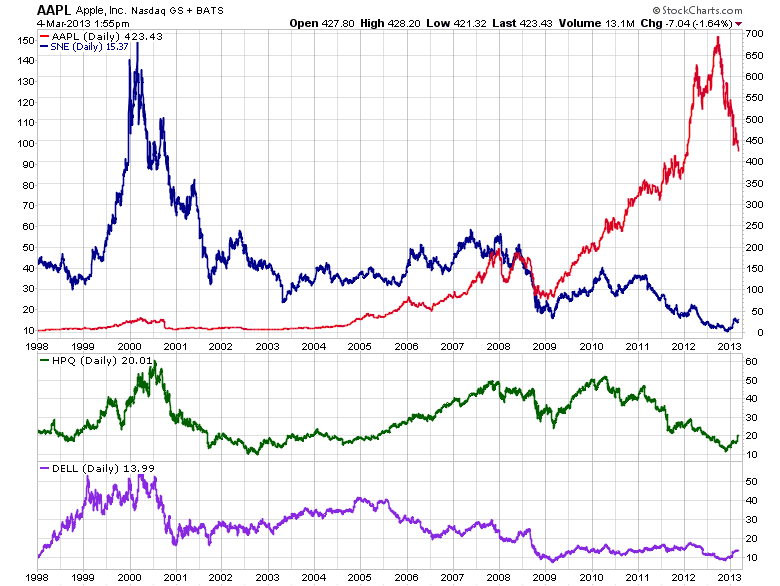
Apple (link) suggesting other stocks I liked better while questioning the valuation assumptions. On Jan 27, 2013 in the comments section to the second article I wrote: I still don't own Apple. It is still just a bit above the open gap that probably needs to fill. Also, these stocks often correct well past where fundamentals say it is a good price as individual investors who bought with all the Apple hype here and on CNBC over the last year give up on it and sell for a loss. When I see Cramer and/or Brinker "give up" on Apple... that might be the bell ringing.Now that the gap is filled, one could take a shot here with a tight stop but beware there are two very strong resistance levels below the current price. Also, open gaps are usually the minimum expected move. Prices often go well beyond open gaps. Brinker gave up on Apple but Cramer still complains about the lousy valuation for the shares he holds after claiming to have sold half his position at a higher price. Below is a graph showing Apple (Ticker AAPL) Resistance & Support Levels from 2008 and a second graph with comparisons to Sony, HP and Dell. Key features listed below the graphs. |
|
Key features:
|
|
|
 |
||
| KirkLindstrom.com Home of "CORE & Explore®" investing. |
Blog |
|||
FREE=> Investment
Letter
SAMPLE <==
FREE
Disclaimer: The information contained in this web site is not intended to constitute financial advice, and is not a recommendation or solicitation to buy, sell or hold any security. This blog is strictly informational and educational and is not to be construed as any kind of financial advice, investment advice or legal advice. Copyright © 2011 Kirk Lindstrom. Note: "CORE & Explore®" was coined by and is a registered trademark of Charles Schwab & Co., Inc. |
||||