 |
S&P500 Inflation Adjusted Price History " Historical S&P500 Real Price Chart " |

|
| Historical Prices of Standard and Poor's 500 Index adjusted for inflation Return to KirkLindstrom.com home page Charts |
|
|
March 5, 2013: This chart1 shows what the S&P500 index looks like when adjusted for inflation. 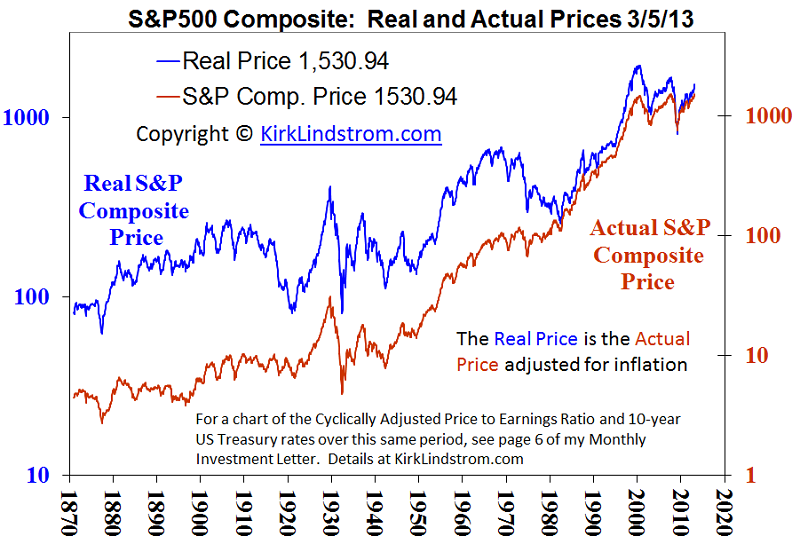 |
|||
|
Robert Shiller writes of the data:
Article:
Beware
of
Annuities
|
|
||
|
Note 1. Source or Raw Data: http://www.econ.yale.edu/~shiller/data.htm or Irrational Exuberance: (Second Edition)
|
|||
 |
|||
| KirkLindstrom.com Home of "CORE & Explore®" investing. |
Blog |
|||
FREE=> Investment
Letter
SAMPLE <==
FREE
Disclaimer: The information contained in this seb site is not intended to constitute financial advice, and is not a recommendation or solicitation to buy, sell or hold any security. This blog is strictly informational and educational and is not to be construed as any kind of financial advice, investment advice or legal advice. Copyright © 2013 Kirk Lindstrom. Note: "CORE & Explore®" was coined by and is a registered trademark of Charles Schwab & Co., Inc. |
||||