|
SOX Index Seasonality Chart Historical Seasonality Chart for the SOX Semiconductor Index |

|
| Newsletter Subscribe Return to KirkLindstrom.com home page - Charts |
|
|
|
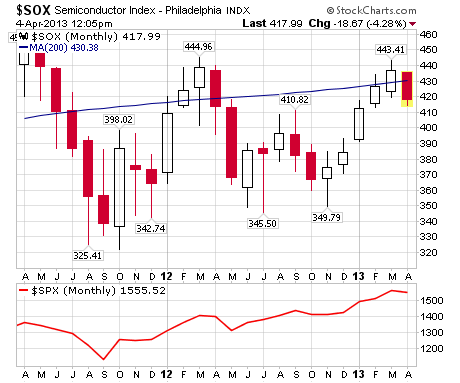
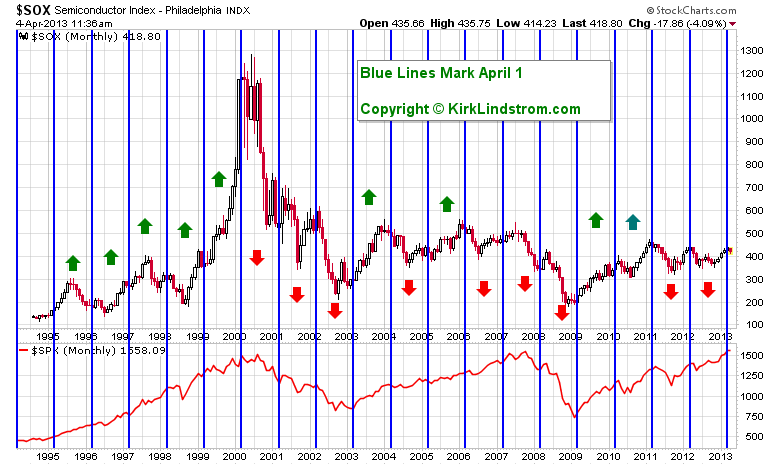
April 4, 2013: The Semiconductor Index (called the SOX) has made three major tops in March during the past 19 years. For this work, I define a major top as any top followed by a 20% or more decline without a higher high. I list my Key Observations below this first chart - List of Semiconductor Exchange Traded Funds |
|
Key Observations:
List of Kirk's 2013 Articles - Semiconductor ETF List
|
|
|
 |
||
| KirkLindstrom.com Home of "CORE & Explore®" investing. |
Blog |
|||
FREE=> Investment
Letter
SAMPLE <==
FREE
Disclaimer: The information contained in this web site is not intended to constitute financial advice, and is not a recommendation or solicitation to buy, sell or hold any security. This blog is strictly informational and educational and is not to be construed as any kind of financial advice, investment advice or legal advice. Copyright © 2011 Kirk Lindstrom. Note: "CORE & Explore®" was coined by and is a registered trademark of Charles Schwab & Co., Inc. |
||||