|
NASDAQ Irrational Exuberance & Pessimism Kirk's Irrational Exuberance & Pessimism Chart for the NASDAQ |

|
| The NASDAQ is breaking above a 5-year resistance line. Kirk Lindstrom's Favorite Charts - Articles - Newsletter |
|
|
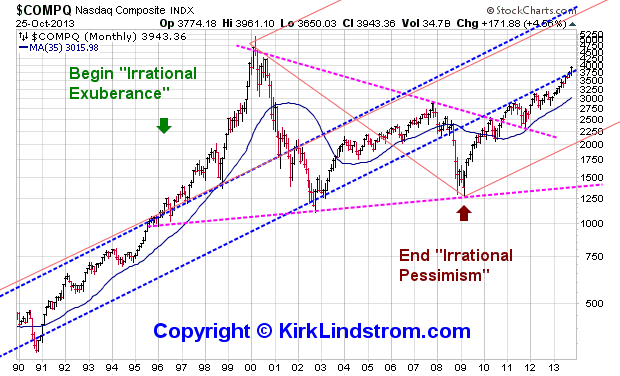
| October 26, 2013:
Below is my chart of NASDAQ Index trend lines with "Irrational
Exuberance" &
"Irrational Pessimism" charted from 1980 through
today. This is an update of a chart I posted three
months ago (July 21 Chart)
when the NASDAQ was just touching the resistance line. This month
the NASDAQ moved above this 5-year resistance line that could now
become support. Chart #3 below shows a close-up of this graph. Chart 1: NASDAQ with Irrational Exuberance and Pessimism Trend Lines Chart 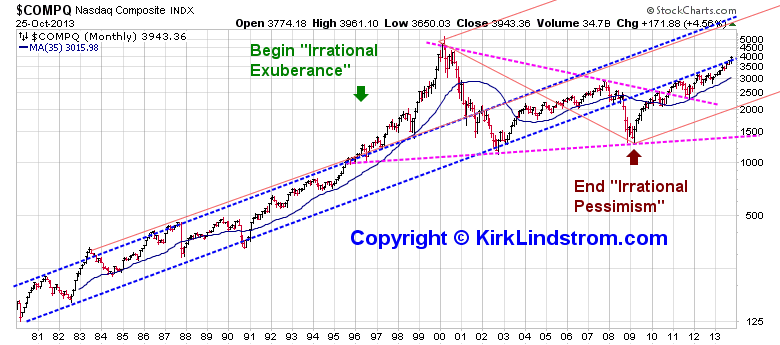  Chart 3: This chart below shows a close-up of the test from above of the breakout of a 12 year resistance line that became "tested from above support" in 2011. |
|
|
|
|
|
Note 1. Source: Stockcharts.com |
|
 |
|
| KirkLindstrom.com Home of "CORE & Explore®" investing. |
Blog |
|||
| Don't Miss Out! ==> Subscribe NOW! <==
Disclaimer: The information contained in this web site is not intended to constitute financial advice, and is not a recommendation or solicitation to buy, sell or hold any security. This blog is strictly informational and educational and is not to be construed as any kind of financial advice, investment advice or legal advice. Copyright © 2013 Kirk Lindstrom. Note: "CORE & Explore®" was coined by and is a registered trademark of Charles Schwab & Co., Inc. |
||||