 |
Chart of the SOX index vs S&P500 Plus Microsoft, Applied Materials and Intel |

|
| More about the SOX: Top Ten Holdings - List of 30 SOX components - Current SOX Values |
|
|
|
November 12, 2013:
Below is my chart of the S&P500 and the SOX (Philadelphia
Semiconductor Index). The SOX is a modified market
capitalization-weighted index composed of companies primarily involved
in the design, distribution, manufacture, and sale of semiconductors.
The SOX began on December 1, 1993 at a base value of 200.00 and was
split two-for-one on July 24, 1995; options commenced trading on
September 7, 1994.
Chart 1: Graph of the S&P500 and the SOX (Philadelphia Semiconductor Index)
Plus Microsoft (MSFT), Applied Materials (AMAT) and Intel (INTC) Note individual stocks are adjusted for dividends while the indexes are not. 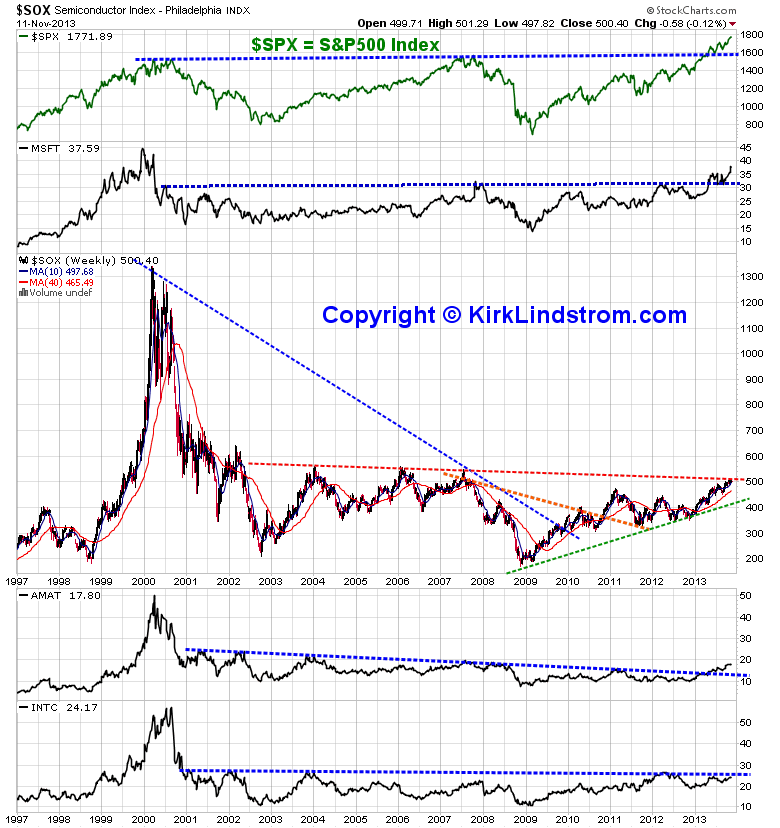 Is it time for a rotation to semiconductors stocks? Subscribe to my newsletter today and see what I recommend owning. (subscribe today and get the November issue for free.) Top Ten SOX Holdings (Filings Data as of: )
 |
||||||||||||||||||||||||||||||||||||||||||||||||||||||||||||||||||||||
|
List of 30 SOX Components
Article:
Beware
of
Annuities
|
|
|||||||||||||||||||||||||||||||||||||||||||||||||||||||||||||||||||||
|
Note 1. Source: Stockcharts.com |
||||||||||||||||||||||||||||||||||||||||||||||||||||||||||||||||||||||
 |
||||||||||||||||||||||||||||||||||||||||||||||||||||||||||||||||||||||
| KirkLindstrom.com Home of "CORE & Explore®" investing. |
Blog |
|||
| Don't Miss Out! ==> Subscribe NOW! <==
Disclaimer: The information contained in this web site is not intended to constitute financial advice, and is not a recommendation or solicitation to buy, sell or hold any security. This blog is strictly informational and educational and is not to be construed as any kind of financial advice, investment advice or legal advice. Copyright © 2013 Kirk Lindstrom. Note: "CORE & Explore®" was coined by and is a registered trademark of Charles Schwab & Co., Inc. |
||||