
|
US CPI vs ECRI's FIG &TIPS Spread Resistance and Support levels for the DOW - Log Scale |
 |
| Return
to KirkLindstrom.com home page Kirk Lindstrom's Favorite Charts - Articles - Newsletter - Blog |
|
|
|
November 20, 2013:
This chart below shows or "CPI-U" graphed versus " aka ECRI's
Future Inflation Gauge" or "FIG" and the 10-Year TIPS
spread. See Definitions.
Chart 1: "CPI vs ECRI FIG vs TIPS Spread" 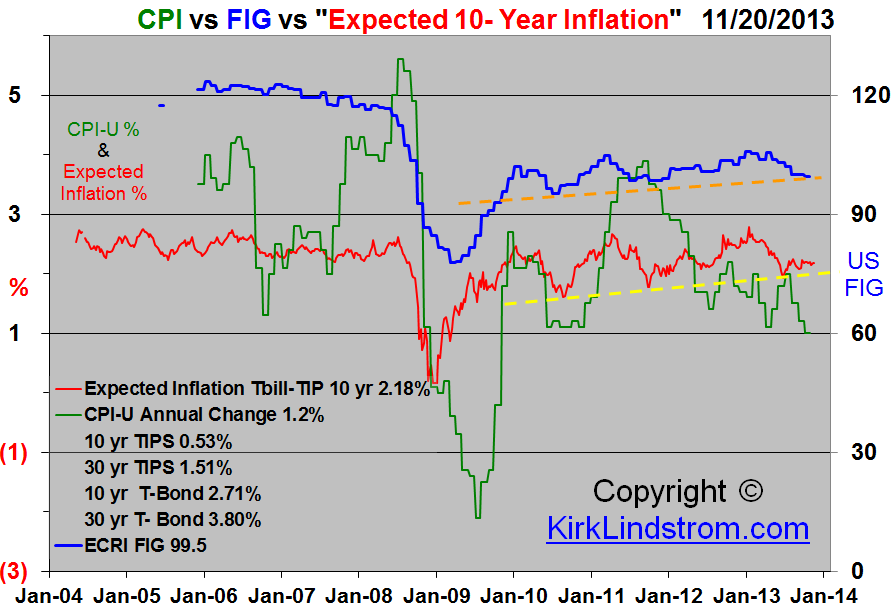 |
| Recommend this on Google +:
|
||
This next chart from ECRI's web site shows inflation in the US and Europe is lower than inflation in Japan! 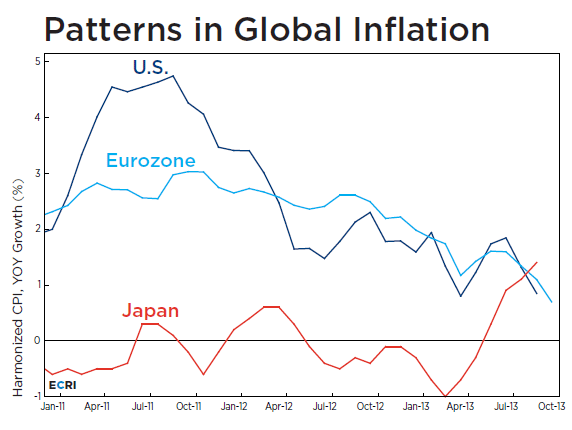 Chart posted on ECRI website as of 11/20/13
Definitions:
Chart 3: "Newsletter Explore Portfolio"
Subscribe NOW & get my November 2013 Newsletter for FREE!  |
|
|
 |
||
| TOP of Page note 1. Source: chart from siliconinvestor.com |
|||||
| KirkLindstrom.com Home of "CORE & Explore®" investing. |
Blog |
||||
FREE=> Investment
Letter
SAMPLE <==
FREE
Disclaimer: The information contained
in this web site is not intended to constitute
financial advice, and is not a recommendation or
solicitation to buy, sell or hold any security.
This blog is strictly informational and
educational and is not to be construed as any kind
of financial advice, investment advice or legal
advice. Copyright © 2013 Kirk Lindstrom.
Note: "CORE & Explore®" was coined by and
is a registered trademark of Charles Schwab &
Co., Inc.
|
|||||