
|
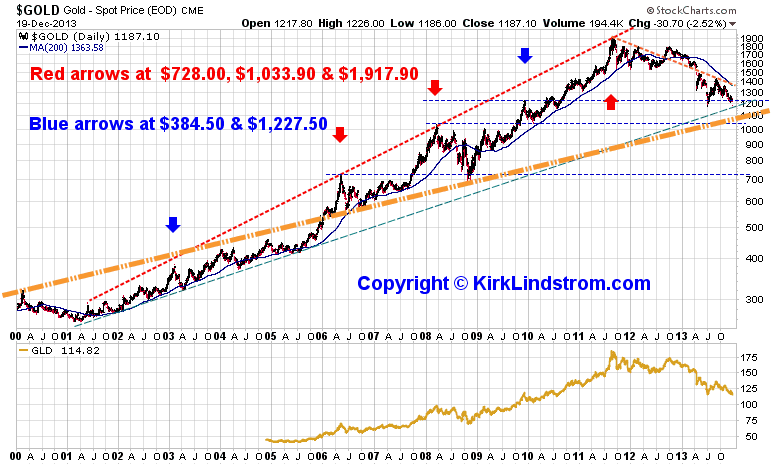
Gold and GLD Resistance & Support Resistance & Support Levels for the price of gold and GLD. |
  |
| Return
to
KirkLindstrom.com
home or Charts page |
|
|
|
December 19, 2013: Resistance and Support Levels for the price of gold and its ETF GLD.
The Daily point and figure (P&F) price target is $1120 which is the next horizontal support line on the first chart below and off the bottom of my second chart. I don't own gold and warned of a possible top way back on August 25, 2011with this post showing Gold at the top of the channel at $1,856. |
Daily point and figure (P&F) pattern for a "Traditional, 3 box reversal chart: 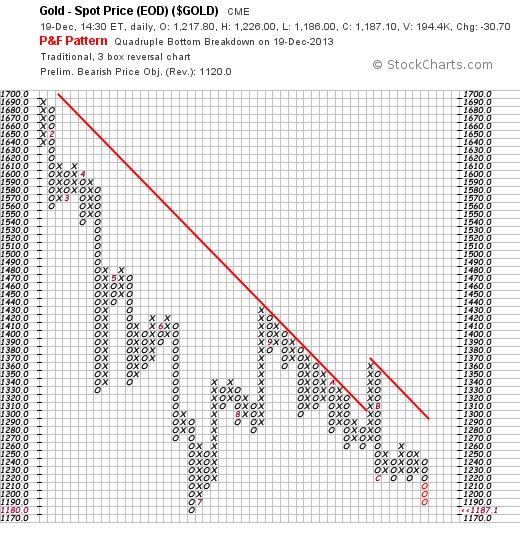 Quotes and Charts for Gold & GLD (the ETF for Gold) DOW to Gold Ratio |
|
 |
|
| note 1. Source: stockcharts.com |
||
| KirkLindstrom.com Home of "CORE & Explore®" investing. |
Blog |
|
Disclaimer: The information contained
in this web site is not intended to constitute
financial advice, and is not a recommendation or
solicitation to buy, sell or hold any security.
This blog is strictly informational and
educational and is not to be construed as any kind
of financial advice, investment advice or legal
advice. Copyright © 2013 Kirk Lindstrom.
Note: "CORE & Explore®" was coined by and
is a registered trademark of Charles Schwab &
Co., Inc.
|
||