
|
Gold and GLD Resistance & Support Resistance & Support Levels for the price of gold and GLD. |
  |
| Return
to
KirkLindstrom.com
home or Charts page |
|
|
|
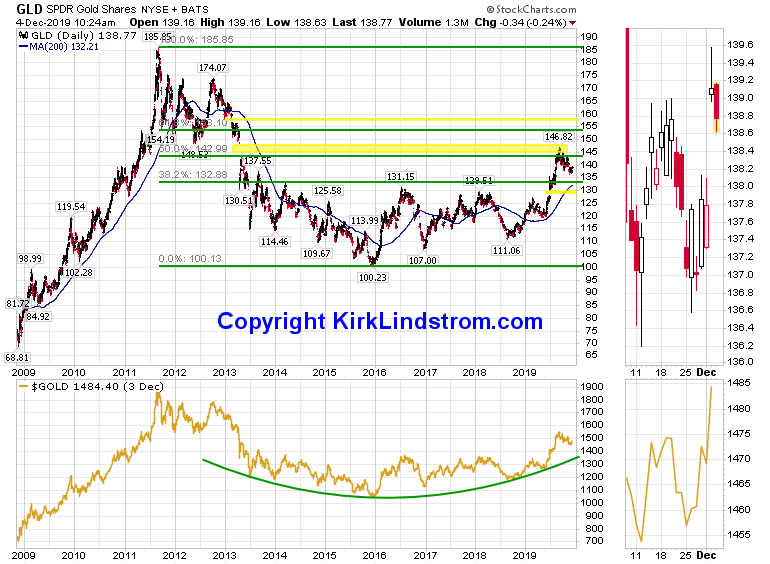
December 4, 2019: Resistance and Support Levels for the price of gold and its ETF GLD.
The Daily point and figure (P&F) price target is undefined but it is currently in a 3-box reversal downtrend. It now shows 4 boxes down but no target. Often these target the last peak box which would be any of the peaks between $136 in 2013 and $130 in 2016. I don't currently own gold as the alternatives I have recommended in my newsletter for inflation protection and pure performance, such as REIT funds and US stocks, have done much better. This could change. |
Daily point and figure (P&F) pattern for a "Traditional, 3 box reversal chart: 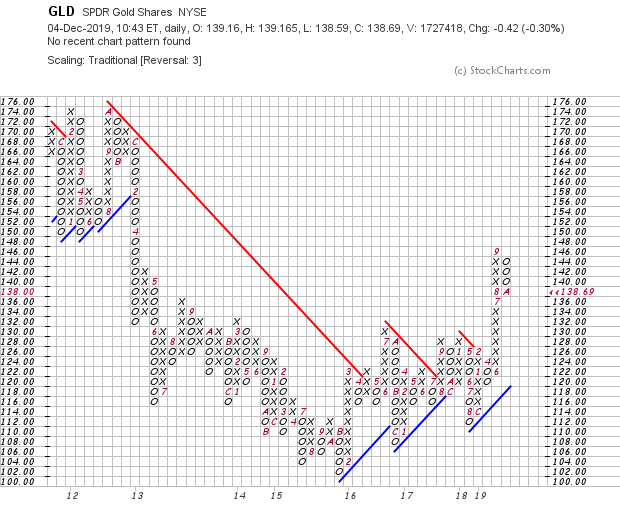 Quotes and Charts for Gold & GLD (the ETF for Gold) DOW to Gold Ratio |
|
 |
|
| note 1. Source: stockcharts.com |
||
| KirkLindstrom.com Home of "CORE & Explore®" investing. |
Blog |
|
Disclaimer: The information contained
in this web site is not intended to constitute
financial advice, and is not a recommendation or
solicitation to buy, sell or hold any security.
This blog is strictly informational and
educational and is not to be construed as any kind
of financial advice, investment advice or legal
advice. Copyright © 2013 Kirk Lindstrom.
Note: "CORE & Explore®" was coined by and
is a registered trademark of Charles Schwab &
Co., Inc.
|
||