 |
2023 Bradley Siderograph |
 |
| Bradley Turn Dates for 2H 2023 Kirk's Newsletter: Subscribe - Charts - Blog More about the Bradley Siderograph |
||
|
June 1,
2023: Donald Bradley
developed the Bradley Siderograph in the 1940s as a
tool for stock market forecasting. Bradley assigned
numerical values to certain planetary constellations
for every day, and the sum is the siderograph.
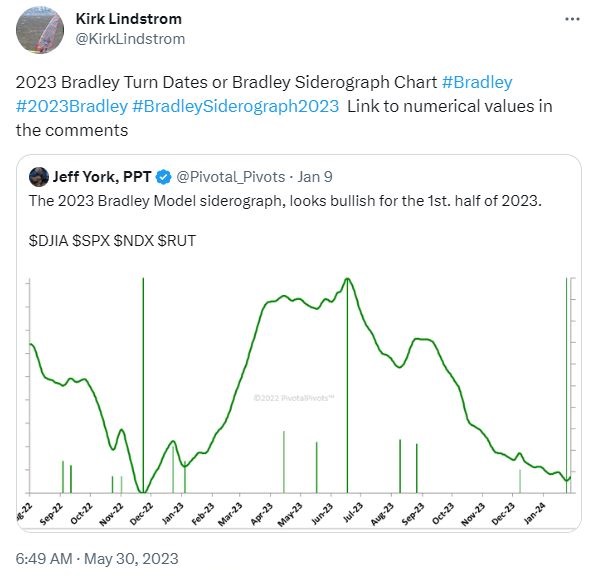 2023
Bradley Turn Dates 1/1/23 thru 6/30/23
Over the years there have
been many interpretations of how to chart the
turn dates for highs and lows. The most
recent I read said the turn days are plus or
minus 4 days and thus make them less
useful. Take it all with a bucket of salt
as I believe there are far better indicators to
pick good times to buy and sell stocks.
For example showing many I follow, read my Feb
11, 2016 Article:
|
|||||
|
In his 1988 book,"Technical
Analysis of Stocks, Options, and Futures
Article Index Many traders and financial astrologers misunderstand the Bradley siderograph. The Bradley siderograph does not reliably predict the direction but only turning points in the financial markets (stocks, bonds, bonds, commodities) within a time window of +/- 4 calendar days. Some incorrectly report "Bradley inversions" which cannot occur because the Bradley Siderograph does not reliably indicate trend directions. In addition, it is not a timing tool for short-term trends but rather for intermediate-term to longer-term trends because the turning window is +/- four calendar days. |
|||||
 |
|||||
| KirkLindstrom.com Home of "CORE & Explore®" investing. |
Blog |
|
|
Disclaimer:
The information contained in this web site is not
intended to constitute financial advice, and is
not a recommendation or solicitation to buy, sell
or hold any security. This blog is strictly
informational and educational and is not to be
construed as any kind of financial advice,
investment advice or legal advice. Copyright ©
Kirk Lindstrom. Note: "CORE & Explore®" was
coined by and is a registered trademark of Charles
Schwab & Co., Inc.
|
||