
KirkLindstrom.com Charts

Return to KirkLindstrom.com home page and Charts page
| KirkLindstrom.com - Charts - 2011 -
DJIA Rising
Wedge Pattern |
==> TA Bible <== | |
|
DJIA Rising Wedge Pattern KirkLindstrom.com Charts |
|
Return to KirkLindstrom.com home page and Charts page |
||
|
|
This rising wedge "reversal"
pattern is a
chart to keep an eye on. 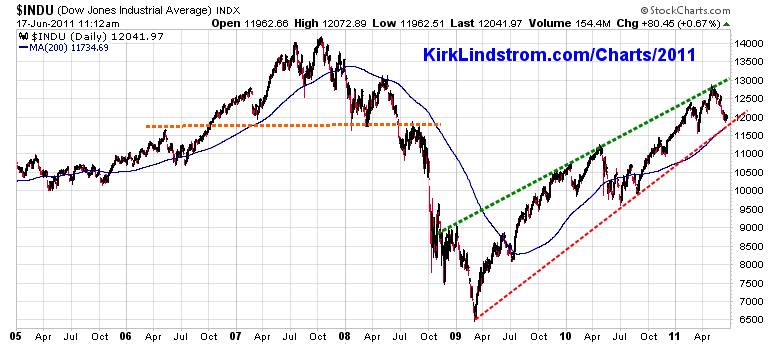 According to Stockcharts.com1"
The rising wedge can be one of the most difficult chart patterns to
accurately recognize and trade. While it is a consolidation formation,
the loss of upside momentum on each successive high gives the pattern
its bearish bias. However, the series of higher highs and higher lows
keeps the trend inherently bullish. The final break of support
indicates that the forces of supply have finally won out and lower
prices are likely. There are no measuring techniques to estimate the
decline – other aspects of technical analysis should be employed to
forecast price targets."
Click to
order Technical
Analysis of Stock Trends |
|
||
| Note 1: Chart courtesy of stockcharts.com at http://stockcharts.com | ||
 |
|||
Return to KirkLindstrom.com home page
|
Blog |
||