 |
Dow Jones Industrial Average Adjusted For Inflation Historical Chart of DJIA Adjusted for Inflation from 1900 to now |

|
| Charts
and price quotes for DJIA and DIA KirkLindstrom.com: Favorite Charts & Graphs - More Articles |
|
|
|
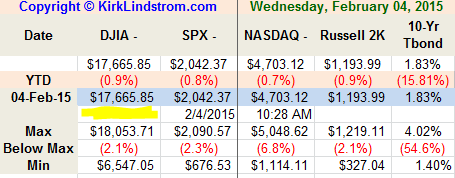
February 4, 2015:
The chart below shows the Dow Jones Industrial Average (or DJIA) adjusted for
inflation on a log scale. Currently, the DJIA at $17,665.85 is 2.1% below its record all time closing high.
Of course, what Chartoftheday neglects to mention is the DOW pays a dividend. If you bought the DOW via its ETF (exchange traded fund) called DIA and reinvested the dividends it earned, currently at 2.02%, then you would be even further above the past all-time, inflation adjusted highs. From Chartoftheday.com1 As the Dow trades approximately 2% below all-time record highs, today's chart provides some perspective by illustrating the inflation-adjusted Dow since 1900 -- there are several points of interest. Take for example an unlucky buy-and-hold investor that invested in the Dow right at the dot-com peak of December 1999. A decade and a half later, the Dow is up a mere 10%. Considering the volatility of that period, it is a return on investment that is definitely not for the faint of heart. On the other hand, take the investor who bought right at the end of the financial crisis. The inflation-adjusted Dow is up a significant 126% from its financial crisis lows -- not bad for a little less than six years. In the end, the inflation-adjusted Dow continues to trend higher and is currently 0.3% below its all-time record high. 
|
|
|
Article: Beware
of
Annuities
Article
Index
|
|
 |
|
|
Note 1. Source:
Chart of
the Day "Journalists
and bloggers may post the above free Chart of
the Day on their website as long as the chart is
unedited and full credit is given with a live
link to Chart of the Day at
http://www.chartoftheday.com."
Charts
and current price quote for Crude Oil Prices |
||
| KirkLindstrom.com Home of "CORE & Explore®" investing. |
Blog |
|
Disclaimer: The information contained
in this web site is not intended to constitute
financial advice, and is not a recommendation or
solicitation to buy, sell or hold any security.
This blog is strictly informational and
educational and is not to be construed as any kind
of financial advice, investment advice or legal
advice. Copyright © 2015 Kirk Lindstrom.
Note: "CORE & Explore®" was coined by and
is a registered trademark of Charles Schwab &
Co., Inc.
|
||