|
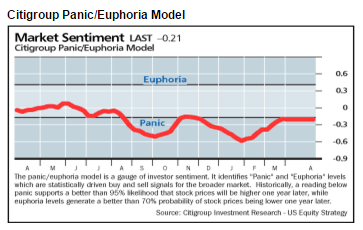
Citigroup Panic/Euphoria Model Citi's Measure of Investor Sentiment For Stocks |

|
| Must Read: Make Money In A Flat Market With Asset Allocation & Market Volatility Return to KirkLindstrom.com home page and Charts page |
|
|
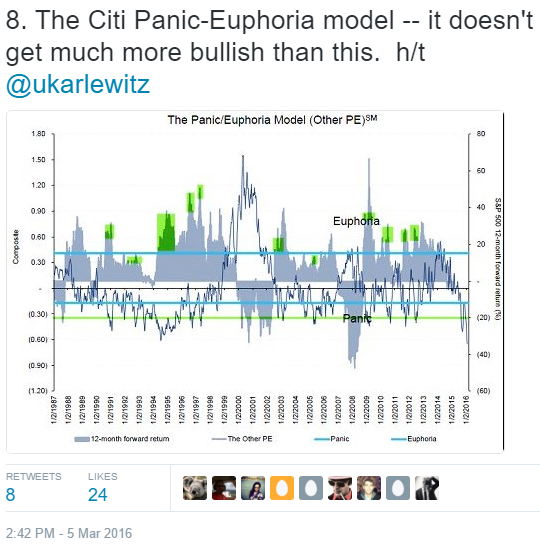
Kirk Lindstrom's Investment Letter Wins the April 3, 2016: The Citigroup Panic/Euphoria Model looks at investor sentiment. These charts show data back to 1987. They show sentiment is up significantly from where I wrote on Feb. 11, 2016 "With SPY Down 14% Again, Sentiment Charts Suggest Another Tradable Low" but still remains well below historical levels as the charts below show. |
|
Today in Barron's Weekly
update of "INVESTOR SENTIMENT READINGS" for April 4, 2016, they show the data for the past year in this chart. This is a good recovery in
sentiment in Citigroup's Panic/Euphoria Model but the charts below show it
remains well below historical averages.
|
|
|
Citigroup's Panic - Euphoria Model from 1987 through today. | ||
On March 10, 2016 John Ross Crooks III posted this chart in his blog "This Historic Chart (Still) Foreshadows a Stock Market Surge" Make sure you read my articles: | ||
 |
||
Return to KirkLindstrom.com home page TOP OF PAGE |
Blog |
|
| Disclaimer: The information contained
in this web site is not intended to constitute
financial advice, and is not a recommendation or
solicitation to buy, sell or hold any security.
This blog is strictly informational and
educational and is not to be construed as any kind
of financial advice, investment advice or legal
advice. Copyright © 2016 Kirk Lindstrom.
Note: "CORE & Explore®" was coined by and
is a registered trademark of Charles Schwab &
Co., Inc. |
||